Data Flow Diagram: A Practical Guide
/DATA FLOW DIAGRAM - Includes Free Template
If you have a massive and complex project with many entities, data, data sources, data destinations and processes going on, a data flow diagram is one of the most effective ways of making sense of all that data. The diagram mostly concerns itself with the flow of data through the system.
The DFD focuses on “what” the system will accomplish and not the “how” of it. It does not provide any information on the timing of information flow in the process or the sequence of activities – It is popularly used in Structured Systems Analysis and Design.
There can be as many levels to a DFD as possible – it depends on the level of granularity you’re trying achieve.
Diagram Notations:
- Gane & Sarson
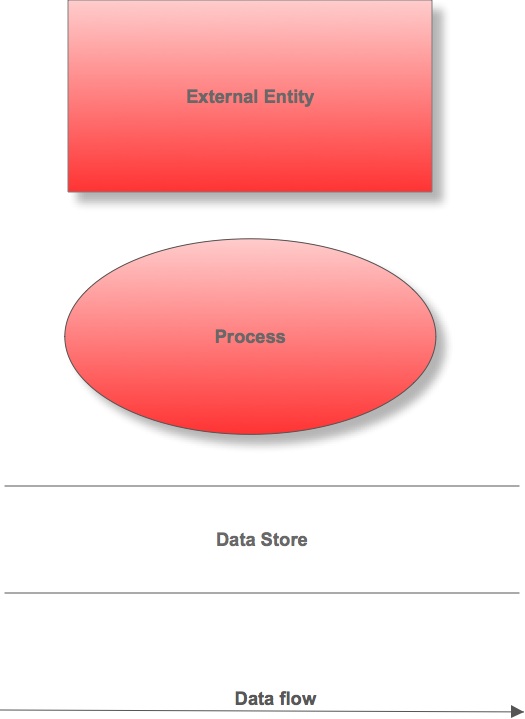
- Yourdon & Coad (Shown below)
PRACTICAL APPLICATION
- List all the external entities that provide inputs to the system or receive outputs from the system
- Identify and list inputs from and outputs to external entities
*These first 2 steps will give you the context diagram*
- Identify all data that passes through the system
- Identify the origin and destination of these data
- Identify the processing that these data go through (processes)
- Identify the means of data storage
- Identify data connections from one process to another
- Identify data connections from processes to the data store(s)
GENERAL RULES
- Don’t let it get too complex; 5 - 7 processes is a good guide
- Number the processes – though the numbering does not necessarily indicate sequence, it’s useful in identifying the processes when discussing with users
- Re-draw as many times as you need to so that it all comes out neat
- All data flows should be appropriately labelled
- Data stores should not be connected to an external entity – because it would mean that you’re giving an external entity direct access to your data files
- Data flows should not exist between 2 external entities without going through a process
- No two data flows should have the same name
- Data flow arrows should point in the direction of the flow
- A data store must be connected to a process
- There should be a minimum of one data flow in and out of a process
- An external entity must be connected to a process
- Watch out for black holes – a process that has inputs but no outputs
- Watch out for miracles – a process with no inputs but visible output
- Process labels should be verb phrases; data stores are represented by nouns
Context Diagram (Context-Level DFD)
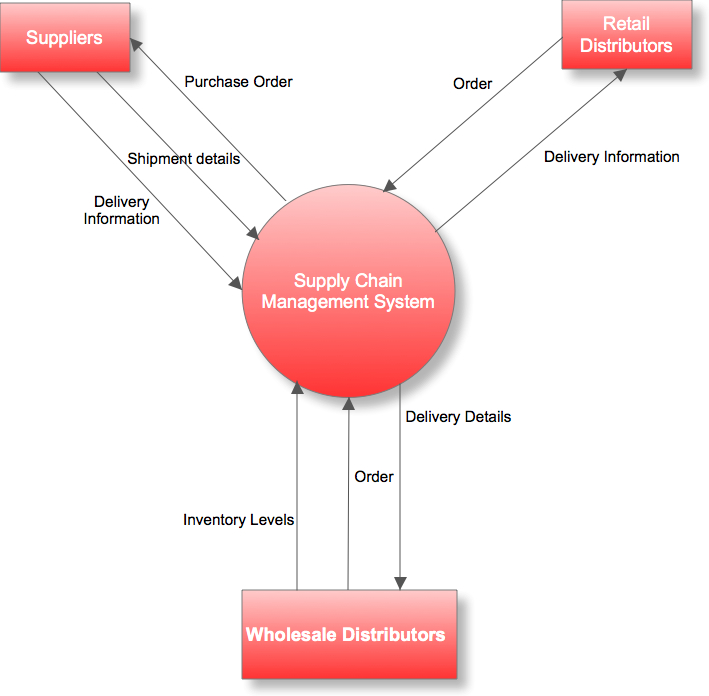
Think of your software system or project as a central entity affected by external agents or external entities. The objective is to show all the entities outside your system that interact with it, either by receiving data from it or transmitting data to it. It reveals nothing on internal processes. An example of a context diagram is shown below for a Supply Chain Management System:
DFD-Level 0
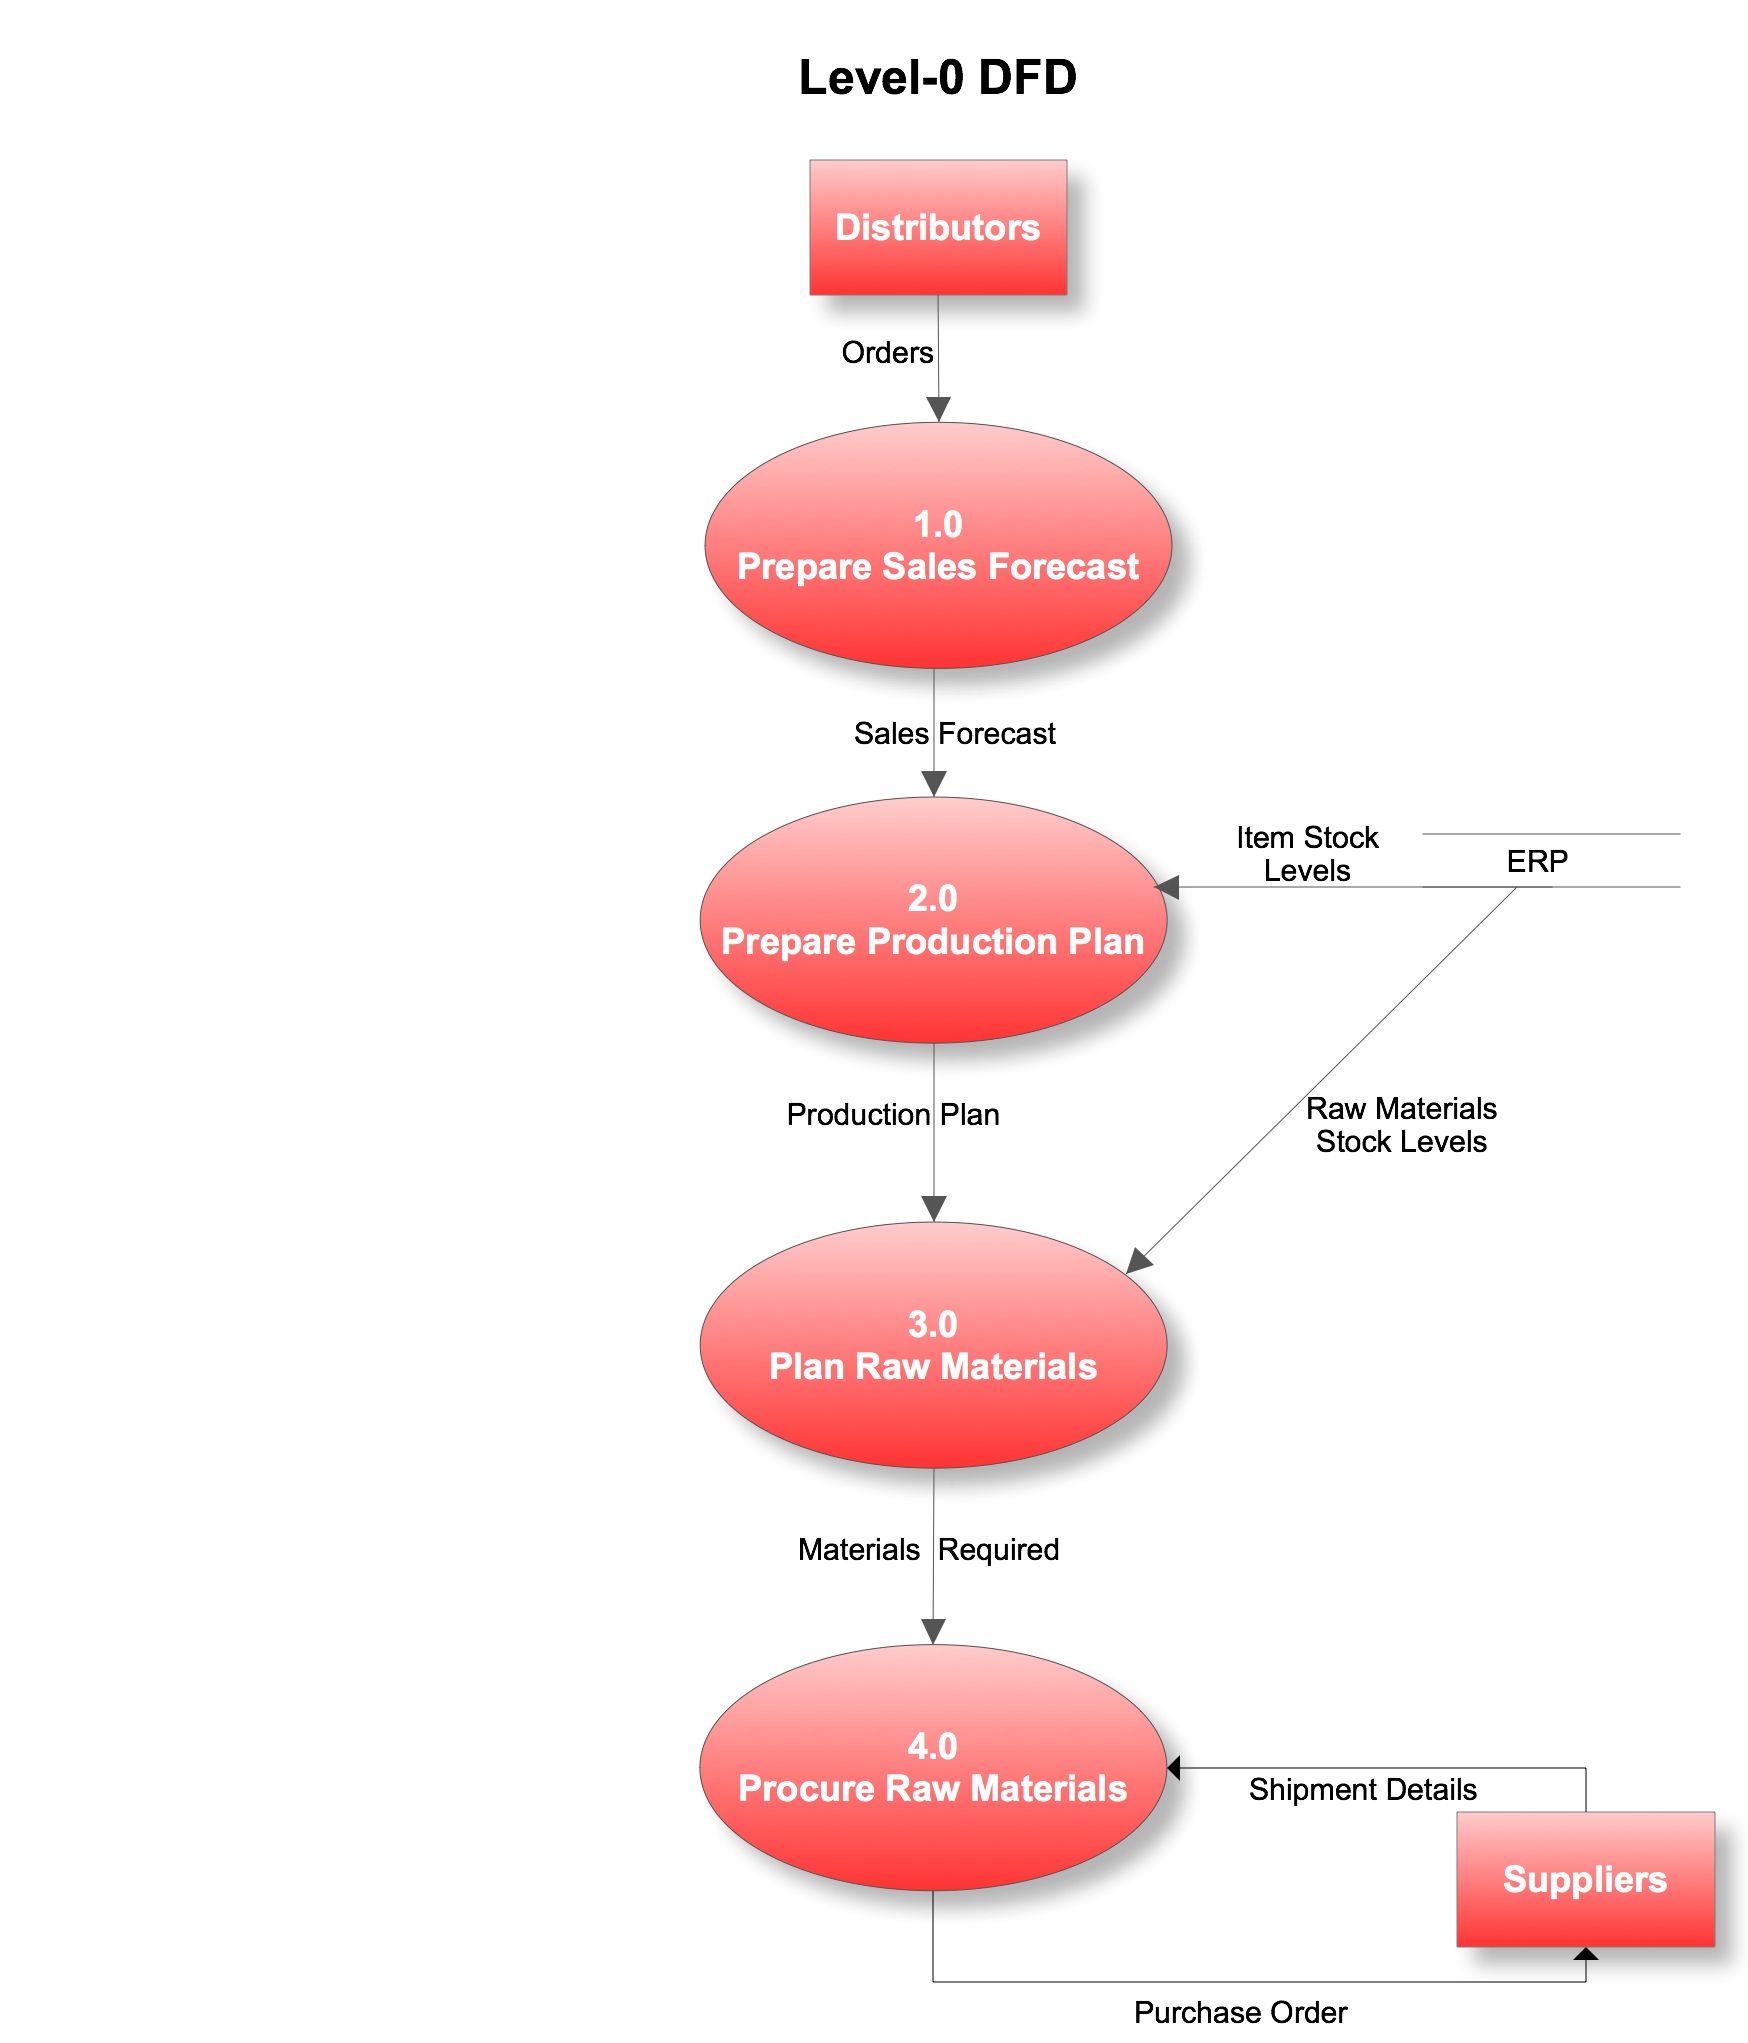
This diagram contains everything in the context diagram but also includes the major processes as well as the data flows in and out of them. The objective is to achieve a higher level of granularity. The processes illustrated here can be decomposed into more primitive/lower level DFDs.
Data Flow Diagram: Level 0
DFD-Level N
This is where you take each process, as necessary, and explode it into a greater level of detail, depending on your preferred level of granularity. For example, DFD-Level 1 could focus on decomposing one of the processes in the Level 0 diagram into its subprocesses. For example, If we take Process 4.0 - Procure Raw Materials, it can be decomposed further into 4.1 - Aggregate Raw Materials, 4.2 - Place Order, 4.3 - Record Shipment Details and so on. If necessary, we can decompose 4.3 further into subprocesses, thereby creating a DFD-Level 2; the resulting processes would be labelled: 4.3.1, 4.3.2, and so on.
Also, see Lucidchart's detailed explanation of what a Data Flow Diagram is.
For more information on how to create a Data Flow Diagram - Download Ed Yourdon's book on DFD which will take you through DFDs from the fundamental aspects to the detailed.
Download the template I used here - It's in Visio XML format and can be imported directly using Microsoft Visio. Systems Analysis & Design in a Changing World also contains an explicit illustration on how to create data flow diagrams. The chapter on DFD is available for free here.


User story maps are an interesting and collaborative way of eliciting user requirements. One of the reasons why I find it so powerful is because it provides a unique approach for aligning discussions relating to the user, their goals, the process that supports the accomplishment of their predefined goals; and the requirements that need to be addressed to solve business problems.