
Mind Mapping
/An existing trend in business analysis is the use of the mind map technique. It has various areas of application such as planning, taking notes, organising ideas, creative problem solving, collaborating, summarising, and so on.
Throughout the analysis phase, the primary role of business analysts is to investigate, evaluate and scrutinise information obtained from stakeholders as well as any relevant project documentation. This can be simplified by applying mind maps to structure the information obtained through a carefully thought-out representation of ideas, concepts, thoughts, and problems.
The fast-paced business environment of today also requires that BAs save time, enhance their effectiveness, and become more creative in their thinking. Mind maps are useful in organising thoughts in a visual and efficient way. An example of its use is in preparing and delivering presentations. It is important to note that the mind map is not a deliverable of the business analyst but is instead, used in the process of understanding the business in order to proffer comprehensive business solutions.
Mind maps may be used to display the connection between images, colours, texts, thoughts and ideas in a non-linear form. Keywords may be used on connections to explain the relationship between parts. It can be drawn manually on paper or by using online software like Lucid chart or Canva, a free online graphic design tool to summarise complex thoughts and ideas.
Creating a mind map requires carrying out the following steps:
Establish the dominant idea and include it in the mind map
Depending on the requirements of the project, the BA should first identify the dominant idea for further exploration and investigation. This idea is placed at the center of the map.
Classify the factors that influence the main idea/problem
After establishing the dominant idea on the mind map, the business analyst should include additional ideas behind the dominant idea. At this stage, the BA may for instance, employ different categories of problem or idea description. These categories aid structuring.
The diagram below depicts a mind map:
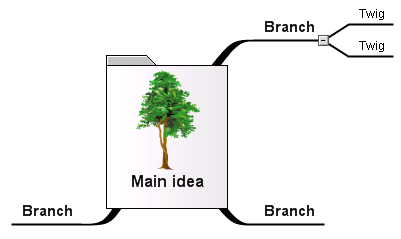
Central image represents the Main idea; Branches represent the main themes or categories of the problem or idea; Branch lines contain keywords that explain association; & Twigs represent sub-topics
Source: Mindmapping
Discuss the main areas suggested above
This stage requires that the main ideas presented are carefully thought-out to offer the best possible ideas aimed at solving existing problems/exploiting opportunities by organizing ideas and identifying the root cause of existing problems.
Though the mind map technique is useful in organizing ideas, it has been criticized for easily being misused as a brainstorming tool (creating relationships between ideas may impede idea generation) and often requiring the illustrator to interpret what has been drawn, since a shared understanding of the mind map can be difficult to communicate.
Mind Mapping Applications
FreeMind
FreeMind is one of the most popular mind mapping software applications available today. It runs on nearly every operating system in existence, is completely free and open source, and there’s a large community around it releasing updates and providing user support. It’s particularly useful for getting organized and keeping track of multiple tasks and projects. Analysts may use it to map out requirements, categorize user feedback, or prioritize their to-do list.
XMind
A polished alternative to the free mind-mapping software FreeMind is XMind, a freemium mind-mapping solution for Windows, macOS, and Linux. XMind has a modern user interface, comes with an abundance of clip art, and automatically synchronizes files across computers. It also works on iOS devices.


User story maps are an interesting and collaborative way of eliciting user requirements. One of the reasons why I find it so powerful is because it provides a unique approach for aligning discussions relating to the user, their goals, the process that supports the accomplishment of their predefined goals; and the requirements that need to be addressed to solve business problems.